Suricata testing 🛡️
📋 Overview
Suricata is a high‑performance, open‑source Network Intrusion Detection System (IDS), Intrusion Prevention System (IPS) and Network Security Monitoring (NSM) engine maintained by the Open Information Security Foundation (OISF). This repository provides a turnkey environment, using Docker and Docker Compose, to deploy Suricata in IDS mode (with an option for IPS) against a simulated industrial network, enabling you to test custom detection rules, generate realistic traffic patterns, and visualize alerts in real time.
🎯 Objective
Setup Suricata in IDS mode (and IPS if needed) to protect a simulated industrial network.
🛠️ Key Features
- Multi‑mode operation: Run Suricata in IDS mode for passive monitoring or inline IPS mode to actively block malicious traffic.
- Custom ruleset: Define and test signatures in
custom.rulesto detect anything from basic port scans to complex industrial protocol anomalies. - Traffic simulation: Generate both legitimate and malicious traffic using example scripts under
scripts/, mimicking user workstations (A, B), unauthorized hosts (U), and an attacker node (M). - Scalable architecture: Each component runs in its own container, making it easy to extend the network or swap out components for more advanced setups.
- Live visualization: Ingest alerts into Elasticsearch and explore them via a Kibana dashboard, templates provided, so you can monitor detections and explore network trends.
🌐 Network Structure
 +-----+         +-----+   +-----+
 |  A  |         |  B  |   |  U  |
 +-----+         +-----+   +-----+
     \             /         /
      \           /---------
       \         /
         +-----+           +-----+
         |  S  | --------- |  M  |
         +-----+           +-----+
            ⇅            /
      .~~~~~~~~~~~.     /
   .~~   INTERNET   ~~.
  '~~~~~~~~~~~~~~~~~~~'
- A and B: Authorized workstations generating normal industrial traffic.
- U: Unauthorized host whose requests should trigger alerts.
- M: Malicious node running exploit and scanning scripts.
- S: Suricata container acting as both router (routing engine) and IDS/IPS sensor. Traffic mirroring is configured to feed packets into Suricata without altering production flow.
🚀 How to Run
-
Build and start the services:
makeOr:
docker-compose up -d --build -
Access the GUI:
Open your browser to http://localhost:3000.
⚙️ How It Works
-
Packet capture: Suricata uses AF‑Packet or NFQueue in promiscuous mode to mirror all forwarded packets from the “S” router container.
-
Rule matching: Each packet is evaluated against rules in
custom.rules. Matching packets generate alerts (and, in IPS mode, can be dropped). -
Log ingestion: Alerts and flow logs are output in JSON to the
eve.jsonlog file, then picked up by Filebeat and shipped through Logstash into Elasticsearch. -
Dashboard visualization: The included Kibana templates let you view:
- Top threat signatures triggered
- Source/destination IP heatmaps
- Timeline of alerts
- Protocol‑specific breakdowns
🧪 Tests
Launch attack or scanning scripts from the Malicious container (M) by running any of the .sh files in scripts/. These simulate real-world ICS threats (e.g., Modbus/TCP fuzzing, port scans) so you can verify that Suricata flags them.
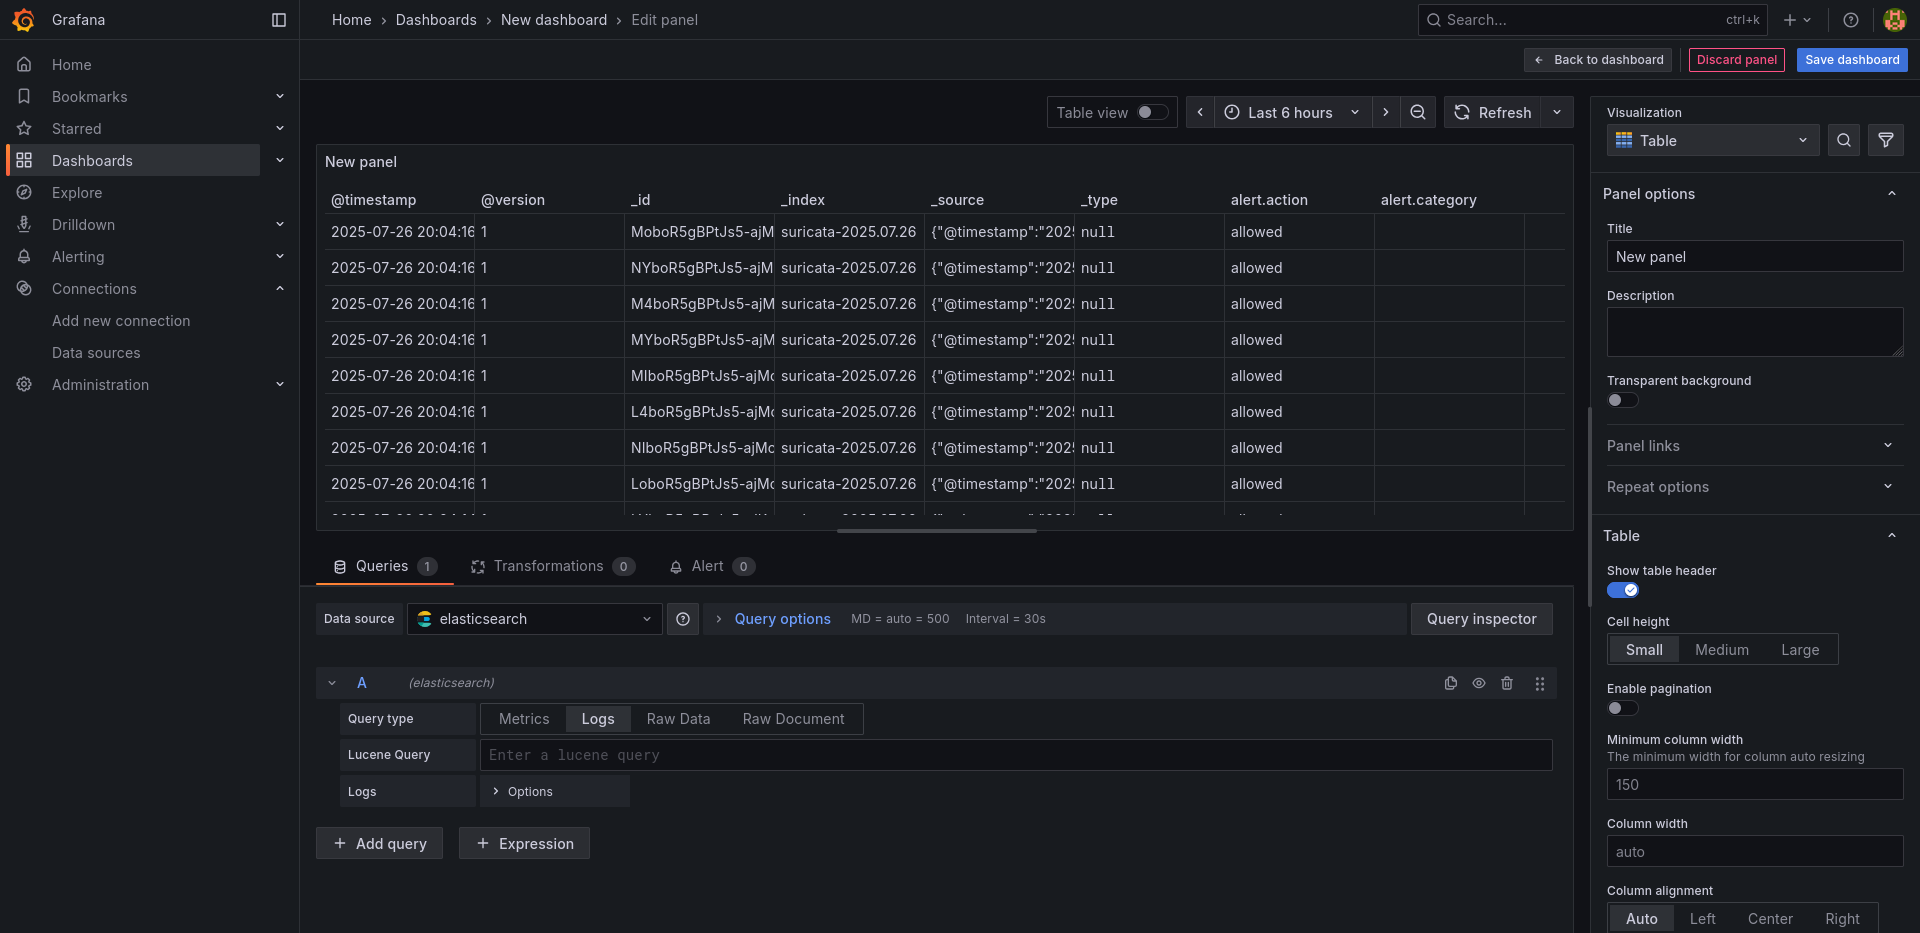
📊 GUI
The GUI at http://localhost:3000 presents an interactive dashboard built on Elasticsearch data. To set it up:
- Create a new Elasticsearch data source:
http://elasticsearch:9200. - Import the provided Kibana dashboard JSON (in
dashboards/if you add one). - Customize charts to display metrics like alert counts, top rules, and traffic volume.